On this page
flex_wrap
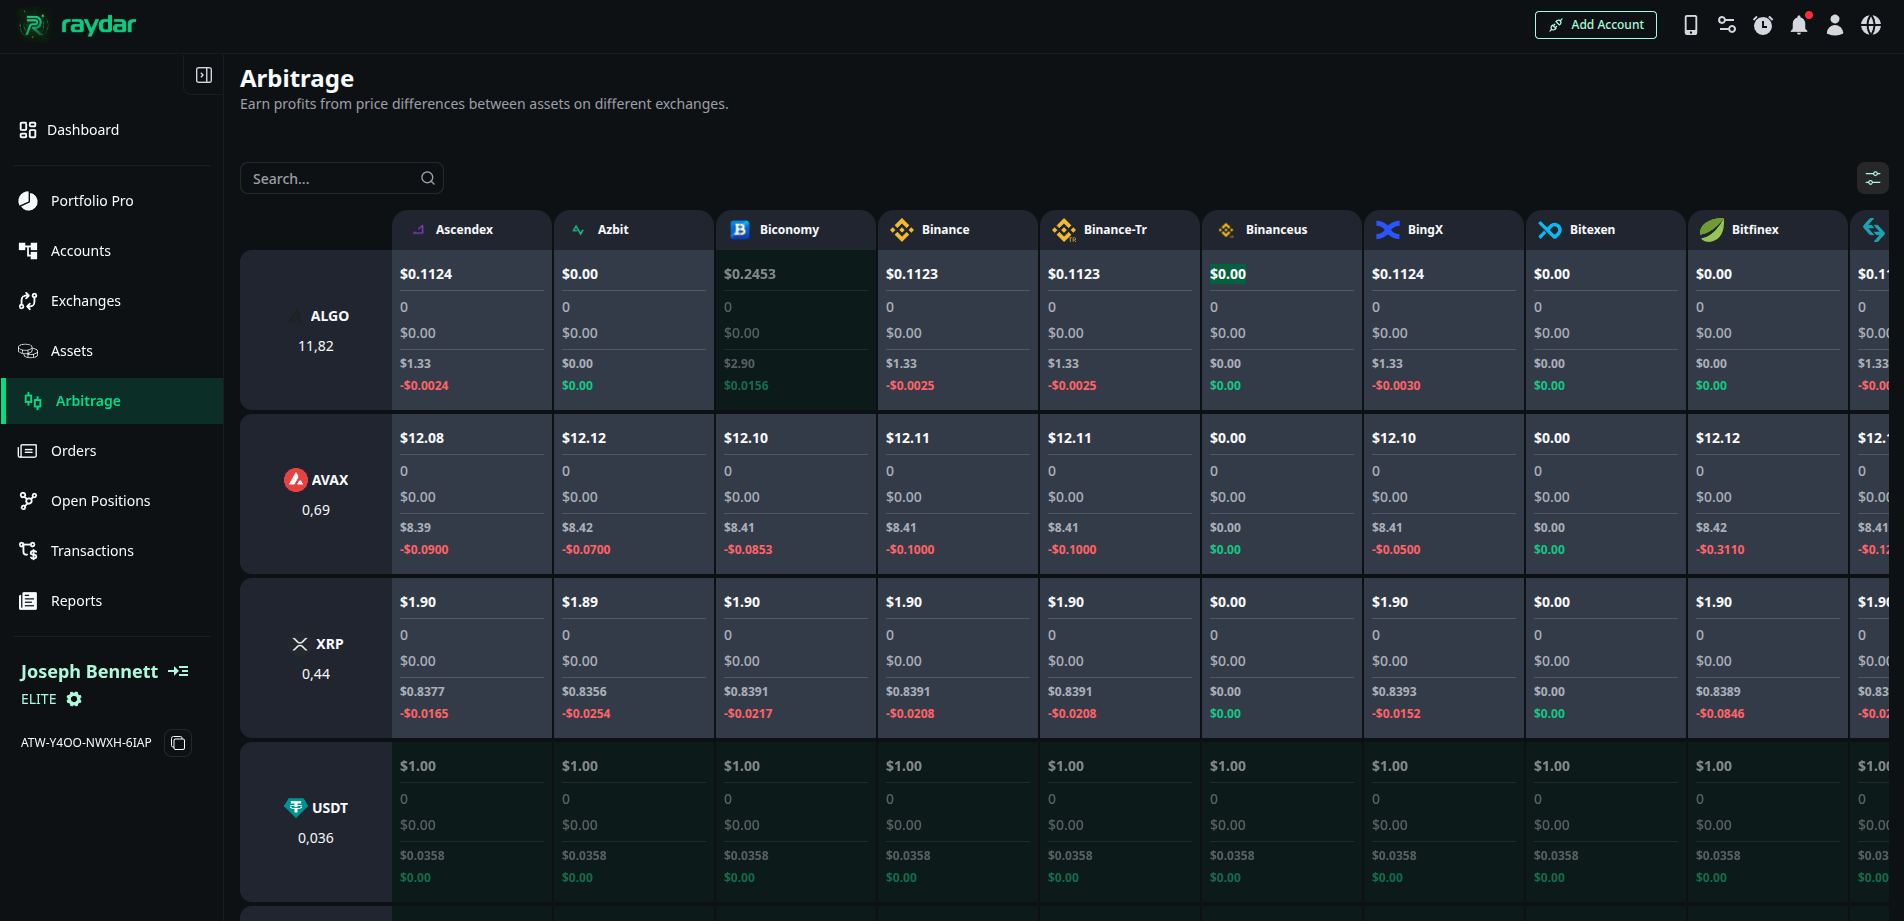
Arbitrage
Earn profits from price differences between assets on different exchanges.
Screen Structure and Data
The table is divided into two main sections:
- Your Assets (Left Side): The list starts with the coins (Assets) currently in your portfolio and the total quantity you hold.
- Market Data (Right Side): Live data from the world’s leading exchanges is presented for each coin:
- Unit Price: The current price per unit of the coin on that exchange.
- Price: The equivalent value of the total quantity you hold on that exchange (Total Value).
- Change: The recent change in price.
- Change % (24hr): The percentage change over the last 24 hours.
- Volume: The trading volume on that exchange.
Arbitrage Logic: What Do the Colors Mean?
Raydar scans this data and automatically highlights the lowest and highest prices for you:
- ● Red (Lowest Price): Indicates the lowest price at which the coin is currently trading in the market.
- ● Green (Highest Price - Opportunity): Indicates the highest price at which the coin is currently trading in the market.
How to Profit? You can generate profit from the market difference by transferring a coin you hold from an exchange where the price is lower (or its current exchange) to the exchange marked in Green (where the price is highest) and selling it there.