Dashboard
Important information about your assets and transactions is available here.
Account Summary and Financial Status
The top section of the Dashboard provides a transparent view of the real-time status of your connected exchange accounts and a general financial summary.

Connected Accounts and Balances
You can view the wallets and exchange accounts integrated into the platform in the left-hand panel (“Accounts”).
- Accounts List: Each connected account card displays its current balance in both USD ($) and BTC.
- Synchronization: The “Synced” label and date information on the account card indicate when the data was last updated.
Financial Summary Panel
The right-hand panel contains cumulative financial data for all your connected accounts. The BTC equivalent is also displayed below each data point:
- Deposit: The total amount of assets you have transferred to the platform.
- Fee: The total transaction fee cost incurred during trades.
- Withdraw: The total amount you have transferred out of the platform.
- Total Balance: The total value of existing assets across all your accounts.
General Statistics (Overview Stats)
Immediately below the financial summary, you will find information cards summarizing the general health of your portfolio and your trading volume. These cards reflect the aggregated data from all connected accounts.
- Accounts: The total number of exchange/wallet accounts connected to Raydar.
- Assets: The total variety of assets (coins/tokens) held in your portfolio.
- Performance Indicator: The arrows next to the asset count represent the real-time performance of your assets.
- ▲ (Green): Shows the number and value of assets currently in profit.
- ▼ (Red): Shows the number and value of assets currently at a loss.
- Open Orders: The total number of currently active buy/sell orders across all your accounts that have not yet been executed.
- Completed Orders: The total number of orders that have been successfully finalized in the past.
- Trades: The total number of buy/sell trades executed across all your accounts.
Market Tracking and Information Flow
The middle section of the Dashboard screen is divided into three main panels for you to track real-time market movements, new opportunities, and the agenda.
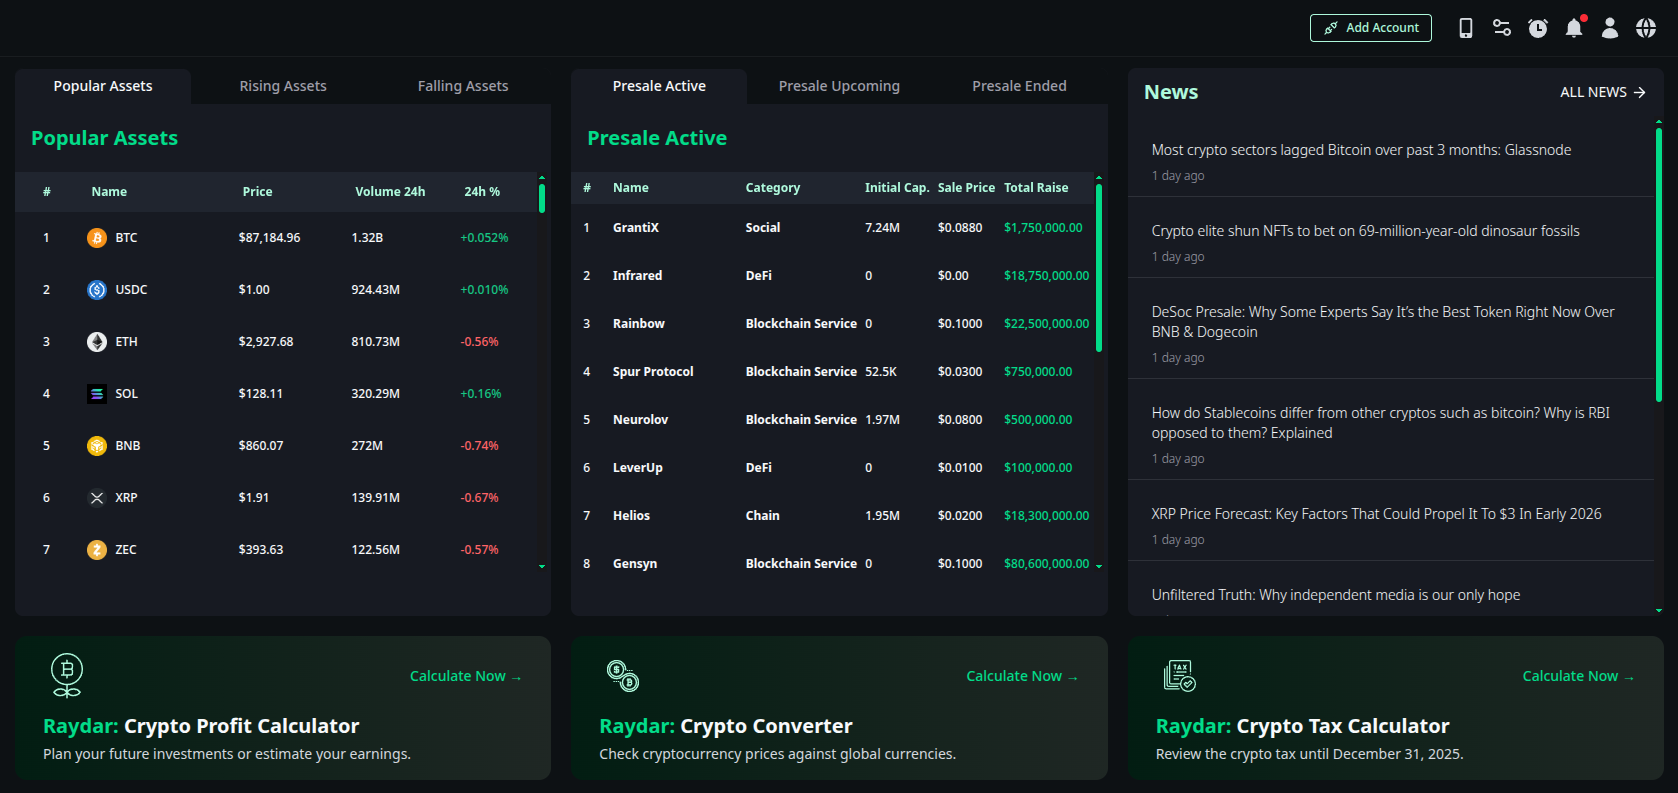
Asset Lists
In the left panel, you can examine assets categorized according to market performance. By switching between tabs, you can access the following lists:
- Popular Assets: The highest volume and most popular assets in the market.
- Rising Assets: Top gainers in the last 24 hours.
- Falling Assets: Top losers in the last 24 hours.
- Displayed Data: Asset name, current price, 24-hour volume, and percentage change.
Presale Radar
The middle panel allows you to catch projects that are just entering the market.
- Presale Active: Projects currently in ongoing presale.
- Presale Upcoming: Projects launching presale soon.
- Presale Ended: Projects with completed presales.
- Details: The project’s category (DeFi, Social, Chain, etc.), Initial Cap, sale price, and Total Raise are listed here.
News Center
The right panel lists critical developments that may affect the cryptocurrency market. You can click on headlines to visit the source or view the entire news feed with the “ALL NEWS” option.
Financial Calculators
Raydar offers three advanced calculation tools at the bottom of the Dashboard that you can use when making investment decisions or performing post-trade analysis. You can open the relevant tool by clicking the “Calculate Now” button.
Crypto Profit Calculator
Allows you to simulate the potential profit or realized loss from your investment.
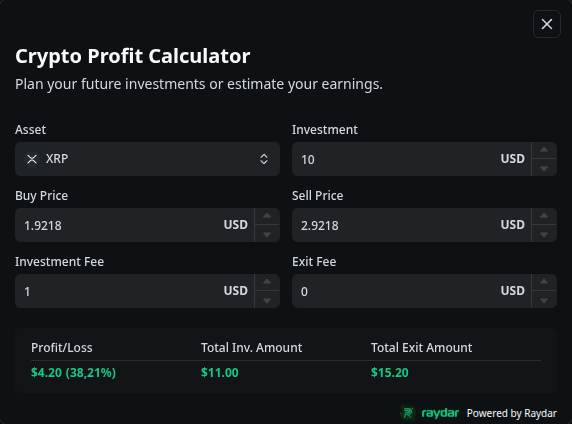
- How It Works
- Asset: Select the asset to trade (e.g., XRP).
- Investment & Prices: Enter your investment amount, Buy Price, and target Sell Price.
- Fees: Add transaction fees if applicable (Investment Fee / Exit Fee).
- Result: The system instantly calculates the net profit/loss amount, your percentage return (ROI), and the Total Exit Amount.
Crypto Converter
Calculates the value of your crypto assets against fiat currencies or other assets based on current exchange rates.
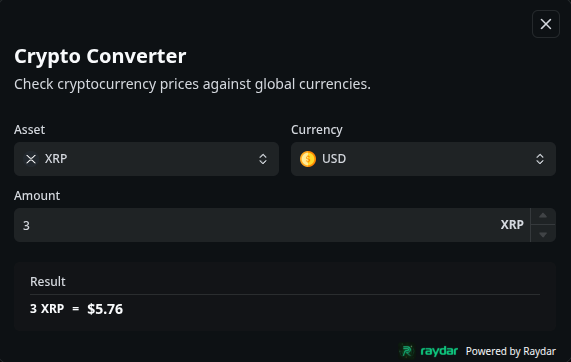
- How It Works
- Select the asset you want to convert (Asset) and the target currency (Currency) (e.g., XRP -> USD).
- Enter the amount (Amount).
- Result: The equivalent value calculated based on current market data appears instantly on the screen (e.g., 3 XRP = $5.76).
Crypto Tax Calculator
Estimates the tax liability of your investments based on the tax rates of your country.
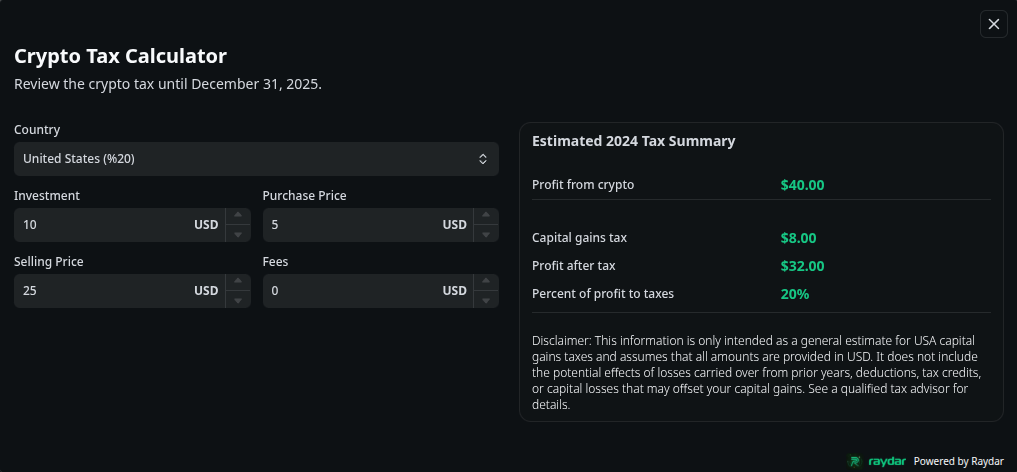
- How It Works
- Country: Select the country where you are a tax resident (e.g., United States 20%).
- Trade Details: Enter the total investment amount, buy price, and sell price.
- Result (Tax Summary):
- Profit from crypto: Gross profit obtained from crypto.
- Capital gains tax: Estimated tax amount to be paid.
- Profit after tax: Net profit remaining after taxes are deducted.
Market Overview & Sentiment Analysis
The bottom section of the Dashboard provides a macro view of the market by combining global trend indicators with real-time market sentiment.
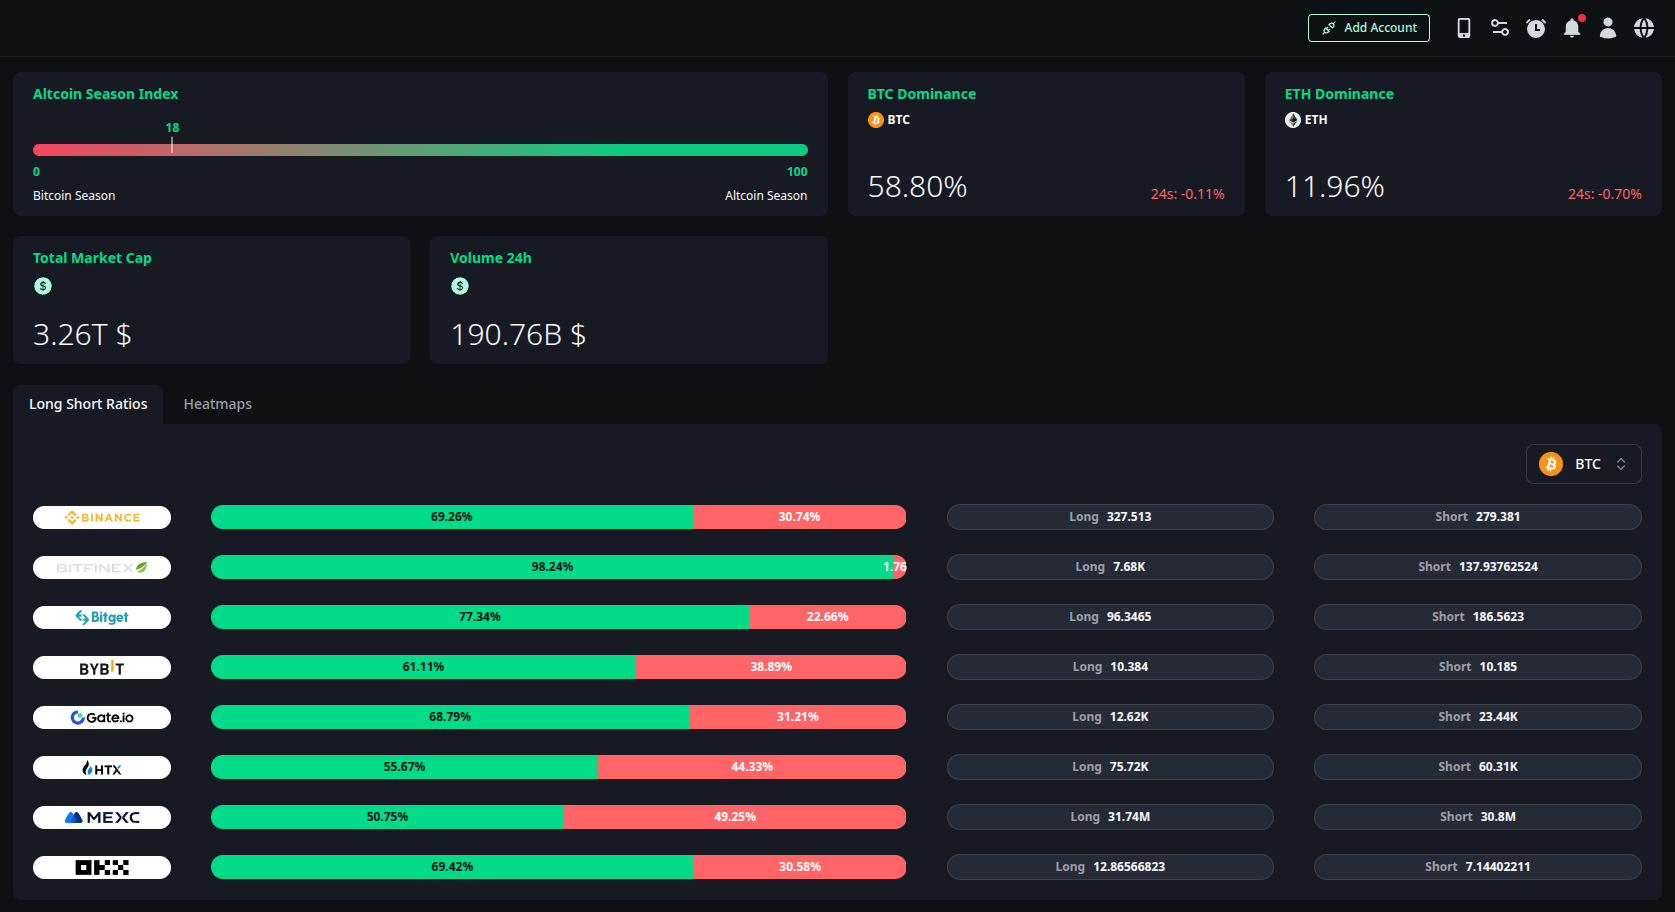
Global Market Indicators
The upper part of this section aggregates data from leading global exchanges to provide an instant snapshot of the general market direction:
- Altcoin Season Index: This index analyzes the most up-to-date exchange data to determine the current market cycle. It visually presents whether the market is in a Bitcoin Season (Bitcoin dominance) or an Altcoin Season (rise of altcoins) on a scale.
- Dominance: Displays the market dominance ratios for Bitcoin (BTC) and Ethereum (ETH), along with their 24-hour percentage changes.
- Total Market Cap: Shows the total capitalization value of the global crypto market.
- Volume 24h: Displays the total trading volume that occurred in the market over the last 24 hours.
Market Depth & Visualization
The lower panel offers two distinct views for you to analyze market liquidity and performance. You can use these tools by switching between tabs.
Long Short Ratios
This tool helps you gauge market sentiment by showing the position distribution for a specific asset (e.g., BTC).
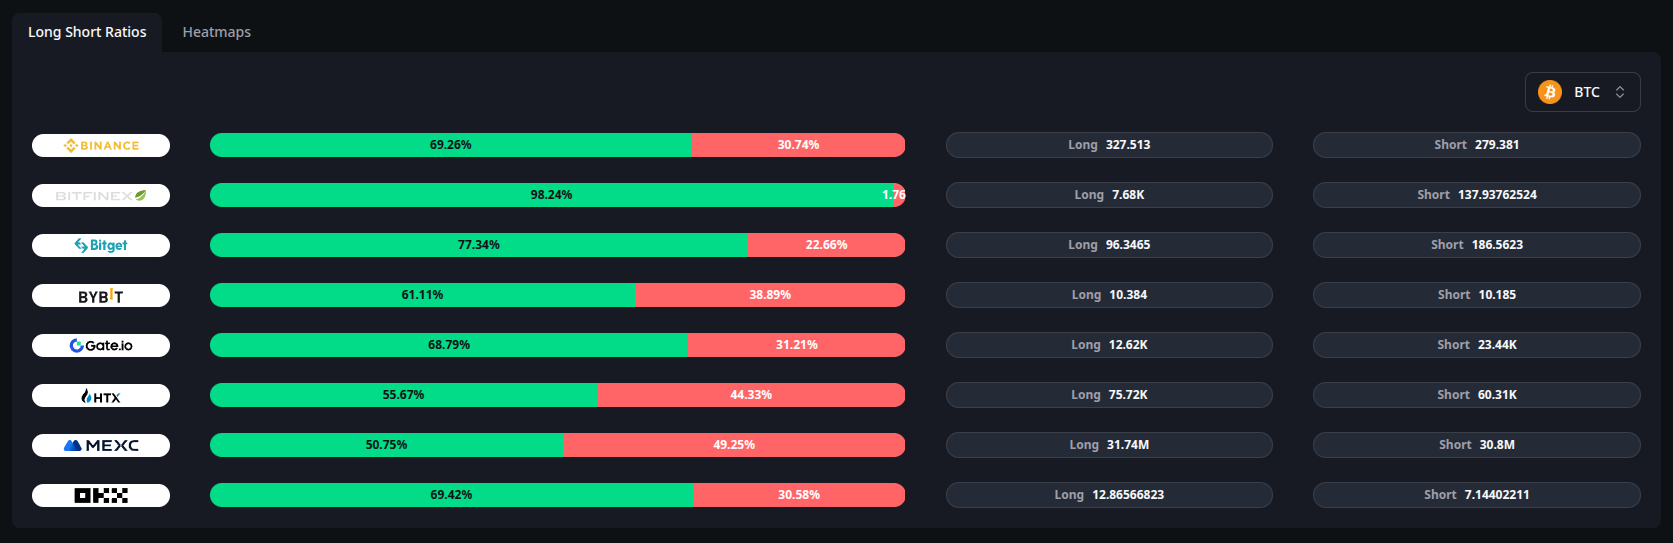
- Exchange Breakdown: Lists leading exchanges individually.
- Sentiment Analysis: Shows the percentage of users in Long vs. Short positions for each exchange.
- Volume Data: Visualizes the volumetric size of Long and Short contracts, helping you identify which direction the general crowd or “smart money” is leaning towards.
Heatmaps
Powered by TradingView, this tool provides a color-coded, visual overview of the entire cryptocurrency market performance.
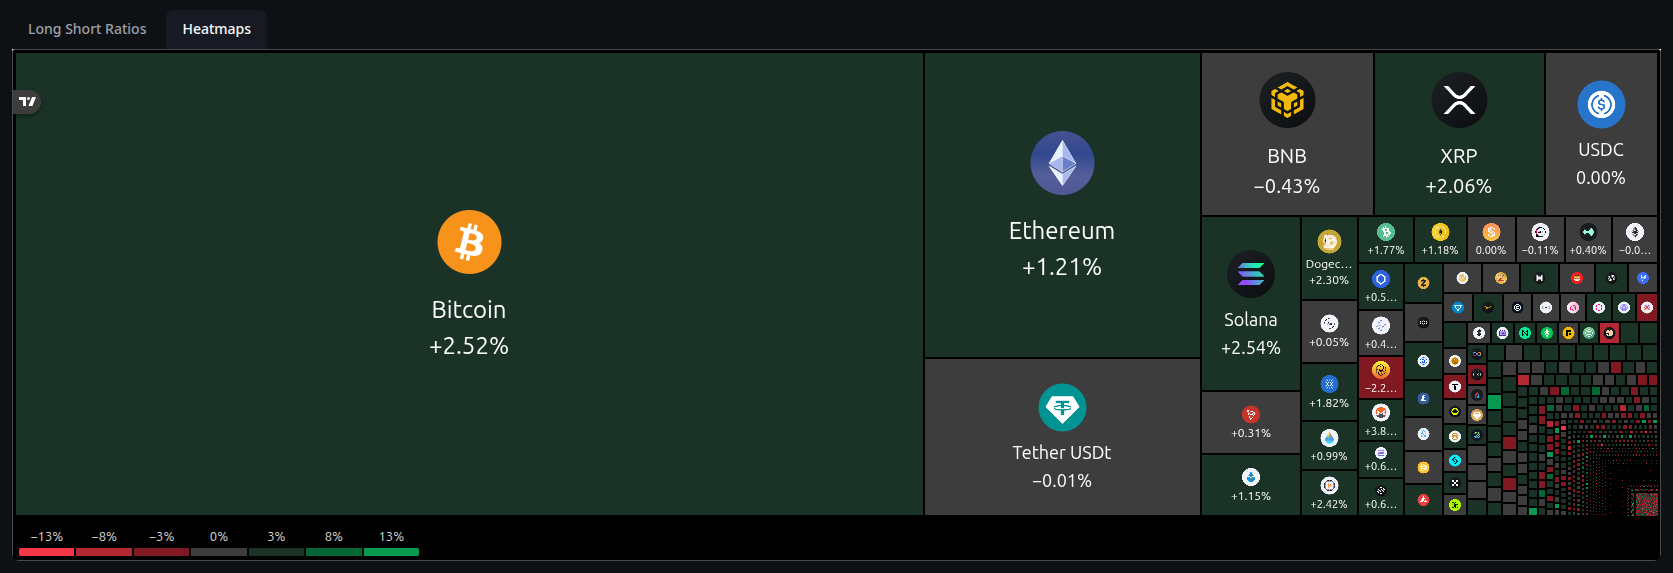
- Visual Performance: Assets are represented by blocks sized according to their market values (Market Cap).
- Color Codes:
- Green: Indicates a price increase (Rising assets).
- Gray: Indicates stable prices or neutral movement (Stagnant assets).
- Red: Indicates a price decrease (Falling assets).
- Instant Analysis: Allows you to analyze market trends and sector-based movements in a single glance.